Performance testing and observability in Grafana Cloud


? Date: September 17, 2025
? Times: 09:30 PT | 12:30 ET | 16:30 UTC
? Online webinar
? About the Webinar:
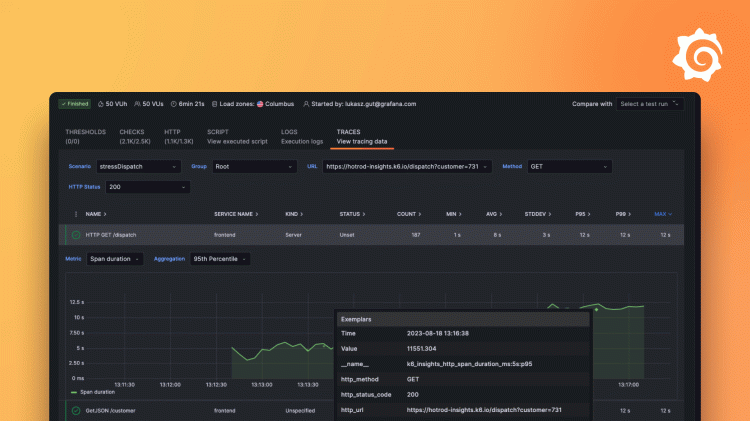
Too many monitoring tools? Tired of switching tabs while troubleshooting? This webinar will show you how Grafana brings together all your metrics, logs, and traces into a unified observability layer.
? What you’ll learn:
- How to connect multiple data sources to Grafana for a single-pane-of-glass view;
- How to build your first Grafana dashboard;
- How to correlate metrics, logs, and traces to resolve incidents faster;
- How to leverage the LGTM stack:
- Loki – logs
- Grafana – dashboards and visualization
- Tempo – traces
- Mimir – metrics
- Sneak peek at what’s new in Grafana 12, the latest release.
No previous Grafana experience required – the session is beginner-friendly.
?️ Your Guide:
Marie Cruz – Developer Advocate, k6 @ Grafana Labs

Ticket Options
FREE
All prices shown are relevant to the date when the event was added to the website. Current prices may differ.