How to query and visualize your Grafana Cloud usage data


? Date: August 20, 2025
? Time:
09:30 PT / 12:30 ET / 16:30 UTC
? What You’ll Learn:
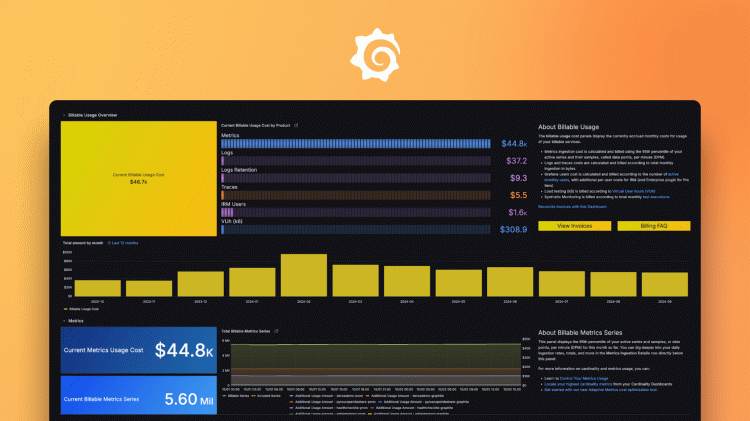
✅ Track real-time usage and understand cost drivers
✅ Optimize costs with Adaptive Metrics and Adaptive Logs
✅ Forecast usage trends and set intelligent alerts
✅ Build a cost management dashboard, step by step
? Track, Forecast, and Reduce Observability Usage in Grafana Cloud
Unpredictable usage spikes. Manual metric audits that eat up your time. Vague or unclear cost contributors. Sound familiar? You’re not alone.
This practical session will help you shift from reactive to proactive cost optimization using powerful built-in tools in Grafana Cloud. Learn to monitor your usage, configure usage forecasts and alerts, and leverage adaptive tools to lower unnecessary expenses.
?️ Your Guide: Wei-Chin Call
Senior Solutions Engineer at Grafana Labs, Wei-Chin will lead you through this hands-on journey to smarter observability cost control.

Ticket Options
FREE
All prices shown are relevant to the date when the event was added to the website. Current prices may differ.